After you've quantitated your images, let's say you end up with the following set of hypothetical data, and your goal was to figure out the effects of treatment A vs B on insulin signaling (pAkt is one of the major proteins involved in the insulin signaling pathway).
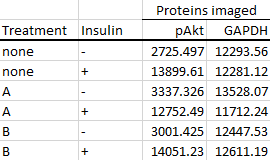
The first step is to calculate the foldchanges of each group from the control group (in this case, it's the group without A, B or insulin treatment).
The reason why we want to calculate foldchanges is simply because of the fact that the numbers ImageJ spits out are arbitrary. The magnitude of these numbers vary depending on a lot of different factors which are practically impossible to control. These include but are not limited to:
Transfer voltage/amperage/time
Primary and secondary antibody concentration
Temperature/time/count of incubations and washes
Number of times the chemiluminescent substrate has been used
Exposure time/position
All of these factors either make the bands on a single blot evenly darker or fainter. Thus, the numbers only have meaning when you look at their relative magnitudes. We need to convert those arbitrary numbers to relative numbers, or so called foldchanges (from the control group). This is so that you can make valid comparisons across different experiments performed at different times and under various conditions.
Calculating foldchanges from the control group
-
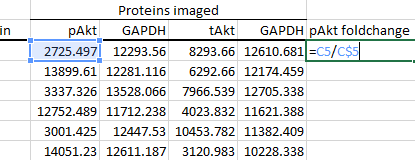
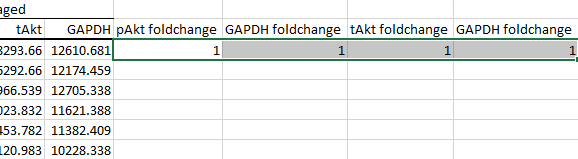
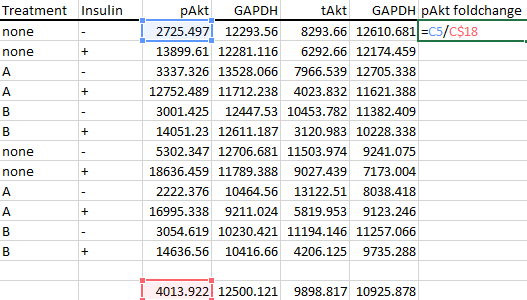
To calculate the foldchange from the control group, you simply divide every number by the control group's number.
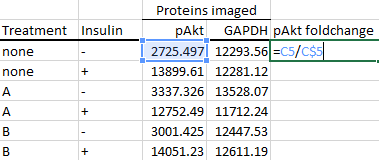
Note the dollar sign placement before the '5' in the formula, as you want to keep dividing by row number 5 when you autofill the other cells below it.
-
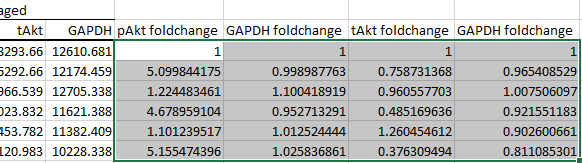
Autofill the cells below it by dragging the tiny square on the bottom-right corner of the highlighted cell
 to the cells that you want autofilled.
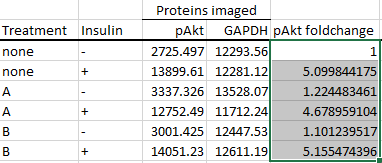
What we're doing here is dividing each row by the first row (the control group's row), thus effectively setting the control group as the baseline.
-
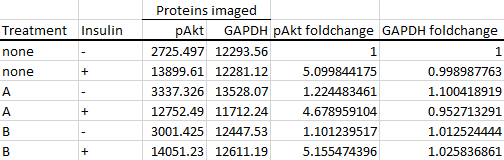
Proceed to do the same for the other proteins that you've imaged.
-
Next, divide your protein of interest's foldchange by the housekeeping protein's foldchange. This is known as housekeeping protein normalisation, and is used to correct inconsistencies between each sample during their preparation and loading. In this case, I've used GAPDH as my housekeeper, but you can also use others such as β-actin or β-tubulin, as long as you've verified that they are stably expressed across your experimental groups.
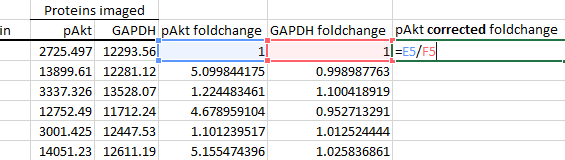
Note: An increasing number of journals are leaning towards total protein normalisation over conventional housekeeping protein normalisation. You can read more about the advantages here.
-
Autofill the cells below it.
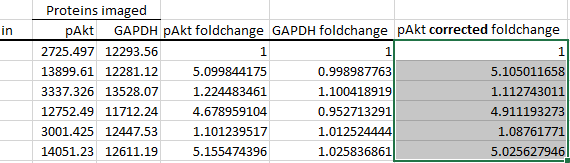
These corrected foldchange values are now ready to be imported into whatever statistical package of your choice and analysed.
Stoichiometry
For proteins without a phosphorylated counterpart, you can stop at the above section. However, for a phosphorylated protein such as the one given as an example above (pAkt, or phosphorylated Akt), you would want to calculate the phospho-to-total ratio as well.
Thus, in a more real-life scenario, you would ideally have performed two western blot runs — one run blotted for phosphorylated Akt, and another blotted for total Akt. Alternatively, you could have only performed one run, blotted for the phospho protein first, then stripped the membrane, and reblotted for the total protein. This is not recommended however, as who knows how much protein is lost from the membrane during stripping. Not to also mention, whether or not protein is evenly lost from different sections of the membrane.
-
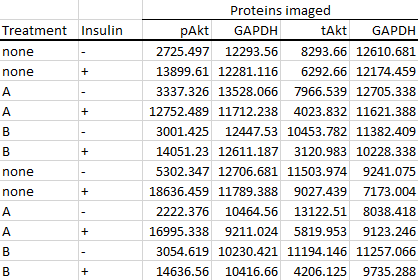
If you imaged both the phosphorylated and total counterparts of the protein, your data should look more like this instead.
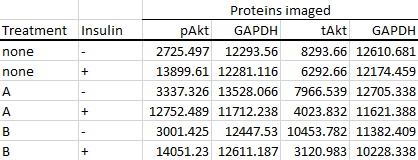
As you can see, you would also end up with two sets of housekeeping protein (e.g. GAPDH) values if you performed two blots. It is always good practice to image the housekeeping protein on every single blot that you do. Performing the normalisation step (previous section, step 5) using housekeeping protein bands quantified from a separate blot is strongly discouraged.
-
Calculate foldchanges as described in the previous section.
-
Then autofill the remaining empty cells.
-
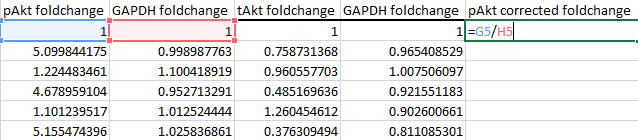
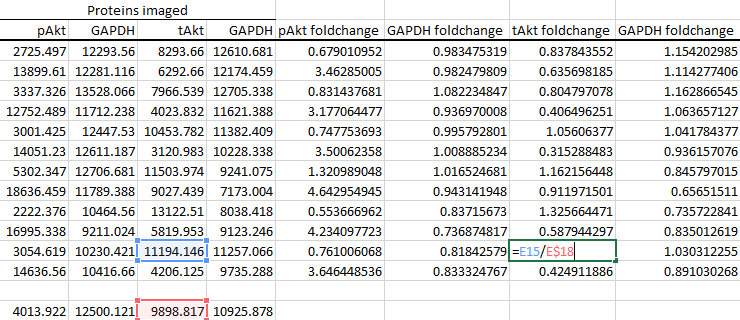
Perform housekeeping protein normalisation, making sure to divide by the correct column of values and not the column that's from a separate blot.
In the data given, the first GAPDH column was quantified from the same blot as pAkt, while the second GAPDH column was quantified from the same blot as tAkt.
Thus, for pAkt, divide by the first column of GAPDH values:
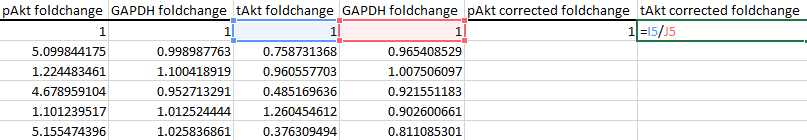
For tAkt, divide by the second column of GAPDH values:
-
Do some autofill hocus pocus...
-
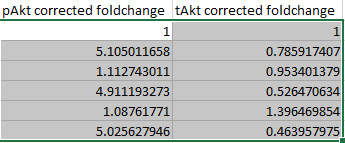
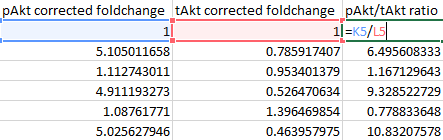
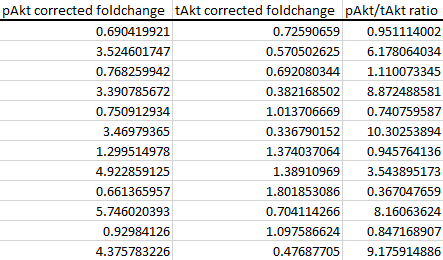
And finally calculate and autofill the phospho-to-total ratio by dividing the corrected foldchange of the phospho-protein by the corrected foldchange of the total protein.
-
Import the pAkt/tAkt ratio values into your statistical package of choice and analyse as before.
Replicates on the same gel/blot
For publication purposes, you would usually want error bars to be present on every experimental and control group you have. But if you look at the control group's (first row) protein foldchanges and ratios in the previous section, you will notice that it's all '1' and thus it would have no error bar. This is because you've essentially set the control group as the baseline when you calculated the foldchanges.
To solve this issue, run replicates on the same gel/blot. For example, run at least two samples from each group on one single gel. You can even run three samples from each group on a single gel if your gel has enough lanes.
If your gel does not have sufficient lanes for the minimum two samples from each group (perhaps you have a lot of experimental groups), what you can do is run one gel with the control group and as many experimental groups as you can fit in replicate, then run another gel with the control group and the remaining experimental groups, also in replicate. Remember, always have the control group on every gel.
-
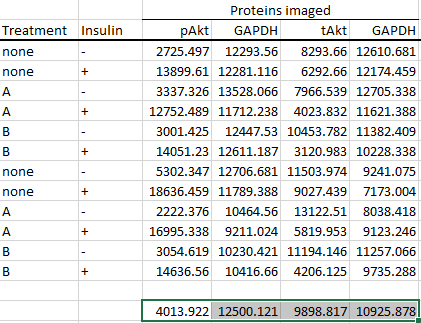
With that out of the way, let's have a look at an expanded version of the dataset from the previous section; this time with the samples in replicate.
We can see double the amount of rows, as two samples instead of just one was run on each gel.
-
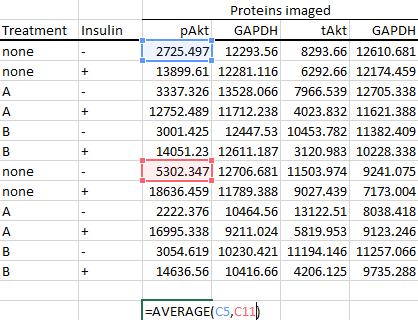
The next step is...you guessed it, calculating foldchanges! However, the way we do it this time is slightly different from what we did in the previous sections. Instead of foldchanging from a single control group, we foldchange from the average of the control groups, since we now have multiple control groups present on the same gel.
So, calculate the average of the control groups for each protein imaged first.
Do the autofill magic...
And finally calculate the foldchanges from the average value of the control groups like so.
-
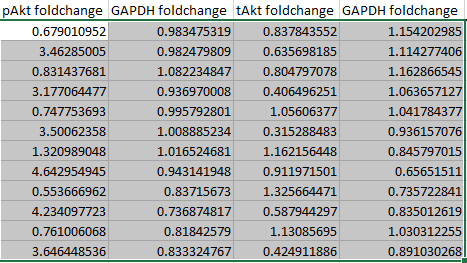
Again, automatically fill in the empty cells by way of sorcery that is autofill.
It's also a good idea to double-click on a couple of random cells to check that Excel has divided the correct cells, as autofill is not totally foolproof.
-
Then do the usual housekeeping protein normalisation, and calculate the phospho-to-total protein ratios (basically repeat step 4-6 from the previous section).
As you can see, the control group's corrected foldchanges and ratios are not perfectly at '1' anymore. Thus, we end up with two unique foldchange or ratio values, making it possible to calculate a standard deviation or standard error of the mean (i.e. error bars) to satisfy our journal editor overlords.
Here's the resulting excel file from the demonstration above, just in case you want to follow along, or see the formulas used in more detail.